






Rent vs. Buy Calculator Guide: 2026 Edition
- Local Editor:Local Editor: The HOMEiA Team
- Category: USA , Cost of Living



Rent vs. Buy Calculator Guide: A monthly housing payment should not only be seen as a bill. This is the single largest structural anchor on a household’s balance sheet, determining whether a family builds lasting wealth or watches capital evaporate.
In mid-2026, the average 30-year fixed mortgage rate was running in the mid-6% range as Freddie Mac’s weekly survey put it at 6.49% on July 9 before it rose to 6.55% for the week ending July 16, the third consecutive weekly increase. The national median home sale price reached $436,733 in March 2026, up 1.2% year-over-year, according to Redfin’s Market Tracker (a figure slightly higher than commonly cited estimates). Against that backdrop, the assumption that buying is always the smarter financial move is no longer automatic. Many online calculators still compare a bare mortgage payment to rent, leaving out escalating property taxes, volatile insurance premiums, and the opportunity cost of a locked-up down payment.
This guide evaluates those variables on a state-by-state and city-by-city level so prospective relocators can see the real math before making one of the biggest financial decisions of their lives.
Key Takeaways
- Unrecoverable Cost Reality: Buying a home carries continuous unrecoverable costs, property taxes, maintenance, and interest. These often exceed rent, pushing the typical financial break-even horizon to five to seven years.
- Price-to-Rent Disparities: Location dictates the outcome. High-ratio cities like San Jose penalize buyers with massive monthly premiums, while low-ratio markets like Pittsburgh offer near cash-flow parity.
- The 5% Rule Check: If renting a comparable home costs less than roughly 5% of the purchase price divided by 12, renting and investing the difference tends to maximize net wealth.

Related article
The 10 Tenants’ Common Questions
1. The Rent-vs-Buy Equation You Aren’t Running
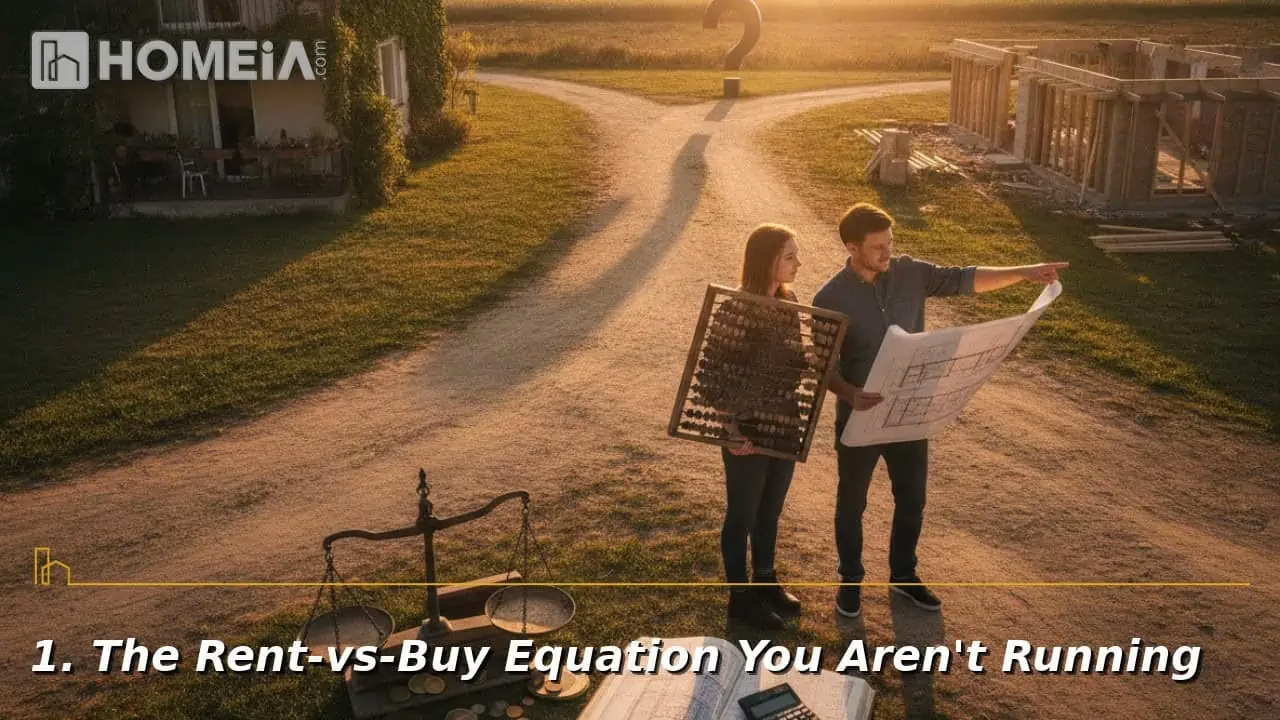
The framework below lays out where capital actually goes under each scenario, based on the latest verified 2026 benchmarks.
| Cost Category | Renting Scenario | Buying Scenario | Verified 2026 Benchmark |
| Housing Access Cost | Monthly rent (~$1,905 avg., 2-bed) | Mortgage interest (6.55% rate) | Zumper National Rent Index, June 2026; Freddie Mac, July 16, 2026 |
| Property Protection | Renter’s insurance (~$15-$30/mo) | Homeowners insurance (~$3,057/yr projected) | Insurify Report, March 2026 |
| Asset Depreciation | None | Home maintenance (~$8,808/yr avg.) | Pearl Certification Report, January 2026 |
| Government Taxation | None | Property taxes (0.9% national effective rate) | ATTOM Analysis, 2025 release (published April 2026) |
| Capital Access Fee | None | Upfront closing costs (2%-5%) | Industry standard, 2026 |
| Capital Friction | None | Selling transaction costs (~5%-6%) | Industry standard, 2026 |
| Opportunity Cost | Lost growth on down payment | Locked capital in home equity | PWL Capital Research, 2019 |
Comparing a mortgage payment to monthly rent is a common mistake trapping first-time buyers. Rent is the maximum unrecoverable cost a renter pays in a given month, while a mortgage payment is the floor of what a homeowner will spend. Owners must also fund property taxes, insurance premiums, and mechanical wear-and-tear. Carrying costs can exceed the mortgage principal by thousands of dollars a year. To make a sound decision, households should weigh their expected years of occupancy against these unrecoverable costs.
A couple of caveats to consider. Opportunity-cost math assumes a household would actually invest its down payment in a diversified portfolio rather than parking it in a low-yield account. Transaction costs apply only at purchase and sale, so their bite is diluted the longer a household stays in a home.

Related article
Best Guide to Buying Your First Home: Saving, Preparing, and Thriving
Homeownership remains the American dream. Though daunting initially, many paths lead to success. This guide provides actionable steps for prospective buyers. The housing market shifts constantly — demand, inventory, and mortgage rates create opportunities and challenges. Understanding these factors is crucial for developing strategies that impact affordability and negotiation power…
2. Why the City You Choose Changes the Math

The national picture is a starting point, but local price-to-rent ratios determine whether buying or renting wins in a given metro.
| Ratio Range | Primary Signal | Monthly Cash Flow Impact | Representative Metro |
| Under 15 | Strong Buy Signal | Owning is cash-flow equivalent or cheaper | Syracuse, NY (Ratio: 12.6) |
| 15 to 20 | Neutral Zone | Toss-up, depends on appreciation and hold period | Austin, TX (Ratio: 21.0) |
| 21 to 25 | Rent-Favorable | Renting is cheaper, buying carries a monthly premium | Des Moines, IA (Ratio: 26.1) |
| Over 25 | Strong Rent Signal | Buying carries a large monthly cash-flow penalty | San Jose, CA (Ratio: 55.0) |
The price-to-rent ratio divides the median home sale price by annualized median rent. Zumper’s 2026 analysis of 83 major U.S. cities found San Jose the most lopsided market at a 55.0 ratio, while Pittsburgh and Syracuse headline the buy-favorable end near 13.0. Across the full dataset, the national midpoint ratio is close to 20, a figure the article’s original FAQ estimate is broadly consistent with, though “approximately 20” is more accurate than a flat national average, since actual local ratios range from roughly 12.6 to 55.0. This metro-level spread is one example of how geography shapes housing decisions; this analysis of geography as a cost-of-living lever explains how the same principle applies across all household expenses, not just shelter.

Related article
15 Important Items to Include in Your Lease or Rental Agreement
The best agreements provide answers to most of the questions that may arise between tenants and landlords, such as who is responsible for what. Here are 15 items and terms you might want to include in your agreement…
3. The Price-to-Rent and PITI Delta Snapshot

The table below reflects Zumper’s verified 2026 dataset combining NAR median home prices, Zumper rent data, and Freddie Mac’s 6.49% rate as of the survey publication date.
| Metro Area | Price-to-Rent Ratio | Median Home Price | Monthly Rent | Est. Monthly Owner PITI | Monthly Cost Delta |
| San Jose, CA | 55.0 | $2,030,000 | $3,073 | $11,666 | +$8,593 |
| Anaheim, CA | 47.8 | $1,442,900 | $2,514 | $8,216 | +$5,702 |
| Honolulu, HI | 36.7 | $1,175,100 | $2,667 | $6,300 | +$3,633 |
| Salt Lake City, UT | 34.9 | $576,500 | $1,378 | $3,306 | +$1,928 |
| Seattle, WA | 32.6 | $772,600 | $1,972 | $4,547 | +$2,575 |
| San Diego, CA | 31.1 | $1,050,000 | $2,818 | $6,026 | +$3,208 |
| San Francisco, CA | 28.7 | $1,350,000 | $3,926 | $7,758 | +$3,832 |
| Milwaukee, WI | 26.8 | $417,900 | $1,299 | $2,986 | +$1,687 |
| Des Moines, IA | 26.1 | $311,200 | $995 | $2,352 | +$1,357 |
| Austin, TX | 21.0 | $460,200 | $1,830 | $3,163 | +$1,333 |
| New York, NY | 14.2 | $750,000 | $4,400 | $4,594 | +$194 |
| Pittsburgh, PA | 13.0 | $234,600 | $1,500 | $1,501 | +$1 |
Every figure in this table is verified directly against Zumper’s July 2026 metro-level dataset, utilizing NAR median prices, Zumper rent data, and a 20% down payment assumption at Freddie Mac’s 6.49% rate. In San Jose, a buyer pays roughly $8,593 more per month to own a median-priced home than a renter pays for a comparable unit, the single largest gap in the dataset. Pittsburgh, by contrast, sits at near-perfect parity, with owning costing only about $1 more per month than renting. Renters in high-delta markets can accumulate substantial wealth by investing that monthly savings gap into diversified assets, while in low-delta markets like Pittsburgh or New York, the case for buying rests more on lifestyle stability than cash-flow savings.
Recommended for you




4. The 5% Rule: Your Financial Sanity Check

The “5% Rule,” popularized by Ben Felix of PWL Capital, compares annual rent to 5% of a comparable home’s purchase price. Ideally, homeownership carries roughly 5% of its value each year in unrecoverable costs, mortgage interest, property taxes, and maintenance, while a renter’s unrecoverable cost is simply the rent itself. Multiplying a home’s price by 5% and dividing by 12 yields a monthly rent threshold. Renting below that threshold is mathematically favorable, assuming the savings get invested.
The three pillars behind the rule, updated with verified 2026 data:
- Property taxes: the national effective property tax rate for single-family homes rose to 0.9% of assessed value in 2025, up from 0.86% in 2024, the highest level since 2020, per ATTOM’s 2025 Property Tax Analysis, released in April 2026.
- Maintenance: Pearl Certification’s 2026 Home Maintenance Cost Report puts average annual spending at $8,808, more than double the traditional 1% rule of thumb and a 42% jump from the $6,200 baseline five years earlier.
- Cost of capital: at Freddie Mac’s 6.55% 30-year fixed rate (week of July 16, 2026), mortgage interest on an 80% loan-to-value loan consumes roughly 3.5%-plus of total home value annually.
Summing these pillars in 2026’s elevated-rate environment pushes the real unrecoverable cost of owning closer to 5.5%-6.5% of home value annually, rather than the 5% rule of thumb. Applying the rule to the actual national median price of $436,733 (Redfin, March 2026), 5% works out to $21,837 in annual unrecoverable costs, or a monthly renting threshold of about $1,820, renting below that figure tends to favor renters who invest the difference.


Related article
When Buying a Home, Make Your Credit Score Work For You
The huge investment of buying a house impacts your lifestyle and your finances. For buyers, it’s essential to understand how to make a credit score work for you, rather than against you. In this article, we’ll discuss your credit report and credit score and the basics of getting them to work for you. Let’s get started…
5. Rigorous Rent-vs-Buy Math: A Seven-Year Hold Scenario

A seven-year hold model illustrates how the math plays out for a household with a $430,000 home, a $86,000 (20%) down payment, and Freddie Mac’s mid-2025/2026 mortgage terms.
| Financial Metric | Buying Scenario | Renting Scenario | Core Assumptions |
| Upfront Capital | $86,000 down payment | $86,000 invested capital | 20% down payment benchmark |
| Monthly Payment | $2,659 PITI (fixed) | $2,400 monthly rent (starting) | Freddie Mac, 2025 |
| Maintenance Allocation | $538/mo (~1.5% annually) | $0 (landlord’s responsibility) | Pearl Certification Report |
| Total Monthly Outlay | $3,197/mo | $2,400/mo (rising ~3%/yr) | Modeled estimate |
| Monthly Cash Delta | $0 (reference case) | $797/mo saved and invested | Modeled estimate |
| Total Wealth (Year 7) | ~$187,300 net equity | ~$225,700 invested assets | 7% investment return vs. 3% home appreciation |
This scenario assumes a 3% annual home-appreciation rate and 7% annualized market return on invested savings, reasonable long-term historical averages. Keep in mind actual outcomes vary by market and portfolio composition. Under these assumptions, the renter’s $86,000 down payment plus a monthly $797 surplus, compounding at 7%, grows to roughly $225,700 in liquid assets after seven years. The buyer’s home appreciates to about $528,000, but after 6% in selling costs and the remaining mortgage balance, net sale equity comes to about $187,300, a roughly $38,400 gap favoring renting-and-investing in this specific high-rate scenario. This is a modeled illustration, not a universal outcome, meaning markets with faster appreciation or lower starting rates would narrow or reverse the gap.

Related article
10 Most Commonly Asked Questions about Renters Insurance
In a world of uncertainties, getting insured is one constant that will give you security, and more importantly, peace of mind…
6. For Those Looking to Buy and For Those Choosing to Rent

Prospective buyers should secure a full amortization schedule from a lender, model potential post-sale property tax reassessments with the county assessor’s office, while considering an independent home performance evaluation (such as a Pearl SCORE certification) to flag inefficient mechanical systems before they become costly repairs.
Renters aiming to build comparable wealth should systematically invest their monthly cash surplus rather than lifestyle-inflate it, negotiate longer lease terms to shield against rent hikes, and monitor local price-to-rent ratios for signs the local market is shifting toward ownership.
Conclusion: What We Are Watching
The Federal Reserve held its benchmark federal funds rate steady at 3.5%-3.75% at its June 17th, 2026 meeting under new Chair Kevin Warsh, and the updated dot plot showed most participants now expect no rate cuts in 2026, with several projecting a possible hike before year-end. This is a distinct rate from the 30-year mortgage rate. While mortgage rates are hovering in the mid-6% range, the Fed’s own policy rate remains well below that level, and its current stance, holding steady while flagging upside risk from tariff- and energy-driven inflation, does not translate directly into “holding above 6%,” a common conflation worth avoiding.
On the rental side, Zillow’s outlook has softened since its initial December 2025 forecast of 0.3% multifamily rent growth for 2026. Newer Zillow projections (as of early 2026) revise that figure down to roughly flat-to-slightly-negative (about -0.2%) for multifamily rents, citing elevated vacancies, a wave of new apartment supply, and heavy leasing concessions. Either way, the direction is consistent. Rent growth is expected to stay muted through 2026, which favors renters relative to a homeownership market still facing elevated financing costs.
Homeowners insurance costs remain on an upward trajectory. Insurify projects a further 4% national average increase in 2026, bringing premiums to about $3,057 by year-end, the fifth consecutive year of increases and a cumulative 46% rise since 2021. Prospective buyers and renters alike should watch upcoming municipal tax assessment cycles and insurance regulatory filings later in 2026, since both directly affect the true cost of ownership.
Recommended for you




FAQs About Rent vs. Buy Calculator Guide
1. What is the average price-to-rent ratio in the United States in 2026?
Across roughly 80-plus major U.S. markets analyzed by Zumper, the midpoint price-to-rent ratio is close to 20, though individual metros range from about 12.6 (Syracuse, NY) to 55.0 (San Jose, CA). Ratios above roughly 21 tend to favor renting, whereas those below 15 align to buying, per Zumper’s rule-of-thumb framework.
2. What is the “5% rule” for renting vs. buying?
The 5% rule estimates homeownership’s annual unrecoverable costs, property taxes, maintenance, and mortgage interest, at roughly 5% of a home’s value; multiplying price by 5% and dividing by 12 gives a monthly rent threshold below which renting is typically the stronger financial choice.
3. How do unrecoverable costs in homeownership compare to renting?
A renter’s unrecoverable cost is capped at rent and renter’s insurance, while an owner’s includes mortgage interest, property taxes (now averaging a 0.9% effective rate), homeowners insurance, and maintenance (averaging $8,808 a year).
4. How long do I need to stay in a home to have buying beat renting?
In most 2026 U.S. markets, buyers generally need a five-to-seven-year hold for ownership to outperform renting financially, driven by 2%-5% closing costs, 5%-6% selling costs, and mid-6% mortgage rates that slow early equity buildup.
5. Is renting really throwing money away?
No, renting buys immediate housing and flexibility while avoiding maintenance risk, while freeing up the down payment for investment elsewhere, which can outperform home equity in high-price, high-rate markets.
6. How does home appreciation impact my break-even horizon?
Faster appreciation shortens the break-even horizon by accelerating equity growth, as flat or 1%-2% annual appreciation can leave unrecoverable interest and maintenance costs outpacing equity gains for years.
7. Does renting or buying build more long-term wealth?
Neither is guaranteed; the outcome depends on local price-to-rent ratios and whether a renter disciplined enough to invest the monthly savings gap actually does so consistently.
Share