







Electricity and Utility Costs by State in 2026 (the first 10 States)
- Local Editor:Local Editor: The HOMEiA Team
- Category: USA , Cost of Living



The 42-Cent Kilowatt-Hour: Why Your Electric Bill Depends More on Geography Than Usage
Electricity and Utility Costs by State: Hawaii residents pay some of the highest residential electricity rates in the nation, roughly 43 to 47 cents per kilowatt-hour depending on the month. North Dakota residents spend around 12 cents. That’s still more than a 250 percent premium for the same amount of power. For a household using the U.S. average of 900 kilowatt-hours per month, that’s well over $350 per month in Hawaii versus roughly $110 in North Dakota. The annual gap runs well past $3,000, and over a decade, adding up to tens of thousands of dollars in added electricity costs.
This gap isn’t closing. The national average residential electricity rate reached roughly 18.83 cents per kilowatt-hour as of April 2026, up more than 7 percent year-over-year, according to EIA Electric Power Monthly data. Data center demand, aging grid infrastructure, and renewable energy transition costs are all pushing rates higher.
For homeowners and renters alike, utility costs are no longer a minor line item. They’re a core component of the affordability equation, volatile more by state than almost any other living expense.
Key Takeaways
- Hawaii has among the highest residential electricity rates in the country, in the low-to-mid 40-cent range per kWh, several multiples of the cheapest states.
- North Dakota remains among the cheapest states for electricity, at roughly 11.5 to 12.35 cents per kWh.
- The national average residential rate is approximately 18.83 cents per kWh as of April 2026.
- Several states, including New Hampshire and New Jersey, saw residential rates climb more than 15 percent year-over-year as of early 2026 data.
- Data center demand is driving regional spikes; ERCOT (Texas) demand could grow significantly in 2026, while PJM (the mid-Atlantic grid spanning 13 states) could see meaningful growth as well.
- A household using 900 kWh monthly pays several thousand dollars more per year in Hawaii than in North Dakota.

Related article
Grocery and Food Costs by State in 2026 (the first 10 States)
The cost of groceries varies significantly across the United States, making location an important factor in every household’s budget. Differences in transportation, supply chains, state taxes, and local market conditions can add hundreds (or even thousands) of dollars to annual food expenses. While national food inflation has moderated, prices continue to fluctuate…
1. National Context: Why Utility Bills Are Rising Faster Than Inflation
Utility rates are not keeping pace with general inflation, they’re outpacing it. While overall inflation ran at roughly 3.3 percent between March 2025 and March 2026, several states experienced electricity rates climb well into the double digits year-over-year.
Aging infrastructure, weaknesses in grid planning and permitting processes, rising system investment needs, and growing electricity demand across the economy are all converging to drive accelerating price increases, according to energy policy researchers.
Data centers are a significant driver. Texas’s ERCOT grid and the mid-Atlantic PJM grid, which spans 13 states including Virginia, are both having structural demand growth driven mostly by rising power demand from data centers. Not one-time spikes, they represent structural demand shifts that will keep upward pressure on rates for years.
The gap between high- and low-cost states will likely continue to widen, not narrow, as this structural demand growth continues.
State Comparison Table: Average Residential Electricity Rates (April 2026)
| State | Rate (cents/kWh) | Annual % Change |
| Hawaii | 43-47¢ | +9.9% |
| California | 32-35¢ | +4.2% |
| Connecticut | 29-32¢ | ~0% |
| Massachusetts | 29-30¢ | -3.9% |
| New York | 24-30¢ | +14.6% |
| New Hampshire | 23-27¢ | +15.1% |
| New Jersey | 19-24¢ | +16.8% |
| Michigan | 21¢ | +9.6% |
| Pennsylvania | 21¢ | +13.6% |
| Idaho | ~12-13¢ | +6.8% |
| North Dakota | ~11.5-12.35¢ | +5.4% |
The table reveals two patterns. First, the Northeast and West Coast dominate the high-cost list, while the Plains and Mountain West dominate the low-cost list. Second, year-over-year changes vary dramatically/ New Hampshire and New Jersey saw double-digit increases, while some states saw prices hold roughly flat or even decline slightly.
Recommended for you




2. Regional Drivers: Why Rates Vary So Much
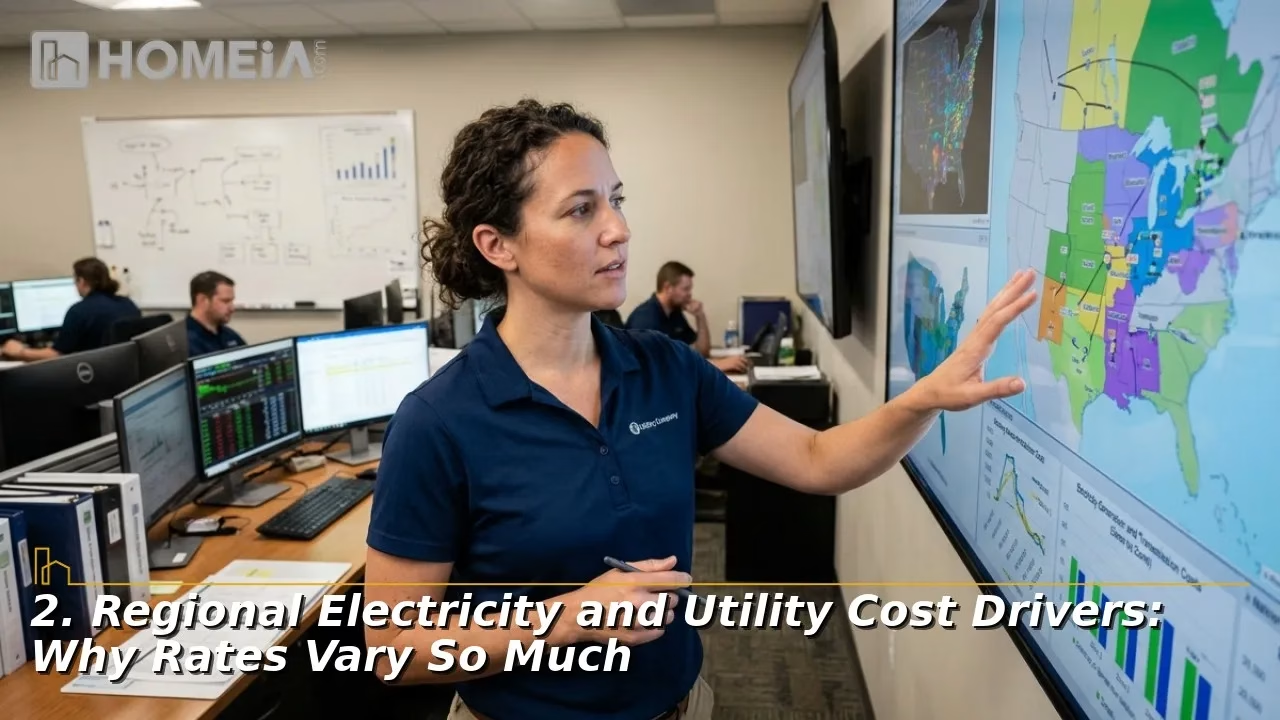
- Deregulated vs. regulated markets. States with deregulated electricity markets, where consumers can choose their retail provider, don’t necessarily have lower rates. Texas has deregulated markets and comparatively low rates. Massachusetts, also deregulated, has lavish rates. The difference comes down to fuel mix and infrastructure, not market structure.
- Climate and HVAC demand. States with extreme temperatures, both hot and cold, have higher electricity demand per household. But that doesn’t always translate to higher rates. Texas has high demand and comparatively low rates due to abundant natural gas. New England has high demand and high rates due to limited pipeline capacity and reliance on imported LNG.
- Renewable energy transition costs. California is a leader in renewable power generation, yet consumers face some of the nation’s highest electricity costs because of transmission investments, wildfire mitigation spending, and other grid-related expenses. Transitioning to renewables is not cost-neutral in the short term.
- Wildfire mitigation surcharges. Western states, particularly California, have added significant surcharges to fund wildfire prevention, vegetation management, and grid hardening. These costs are passed directly to ratepayers and show no signs of decreasing.

Related article
Auto Insurance Cost Guide by State in 2026 (the first 12 States)
Auto insurance costs vary widely across the United States, making your state of residence one of the biggest factors affecting what you pay. Differences in accident rates, weather risks, repair costs, insurance regulations, and litigation trends create substantial variations in premiums from one state to another. This guide compares average auto insurance costs across the country…
3. The Real-World Impact: A Homeowner’s Utility Budget

Consider two homeowners, one in New Hampshire, one in Idaho. Both own 2,000-square-foot homes, use 900 kWh per month, and run electric heat and air conditioning.
The New Hampshire homeowner pays in the mid-20-cent range per kWh, with a monthly bill in the $220-$250 range and an annual bill encroaching $3,000. The Idaho homeowner pays roughly half that rate, with a monthly bill closer to $115-$120 and an annual bill around $1,400. The New Hampshire homeowner spends well over $1,500 more per year on electricity alone.
Now add heating. Both states have frigid winters. However, New Hampshire’s higher electricity rates make electric heating less economical, meaning homes there use oil or propane instead. This carries its own cost burden, often $2,000 to $2,500 annually. Idaho’s lower rates make electric heat more viable, often costing homeowners $1,000 to $1,200 annually. The combined utility gap between the two states widens to nearly $3,000 per year once heating fuel is factored in.

Related article
Childcare Cost Calculator by State in 2026
Childcare is one of the largest recurring expenses for American families, and costs vary dramatically from state to state. In many high-cost states, full-time infant care rivals or even exceeds annual housing expenses, while more affordable regions offer substantially lower out-of-pocket costs. Differences in wages, childcare availability, and public funding all influence what families ultimately pay. This guide compares childcare costs across the United States,…
4. How Utility Costs Factor into Homeownership Calculations
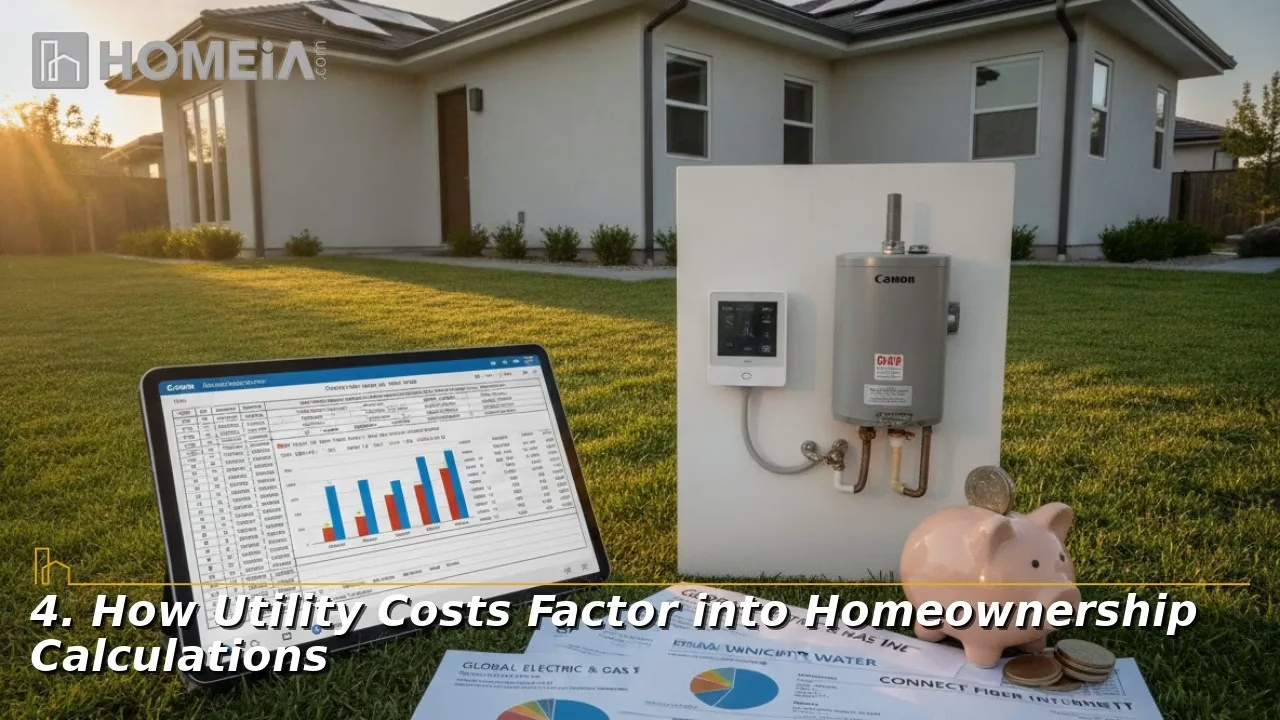
When evaluating a home purchase, most buyers focus on the mortgage payment. But, utilities can add 10 to 30 percent to your monthly housing costs, depending on the state.
A $300,000 mortgage at 6.5 percent costs roughly $1,900 per month in principal and interest. Include property taxes, insurance, and maintenance, and you’re at $2,500 to $3,000 per month. Now add utilities. In a high-cost state like Connecticut, that’s another $250-$270 per month for electricity alone. With a low-cost state like North Dakota, it’s closer to $105-$110. The difference is enough to change the affordability calculation for a marginal home purchase.
5. Practical Guidance: Reducing Utility Bills

- HVAC efficiency is the largest lever. Replacing an old air conditioner or furnace can cut energy use by 20 to 40 percent. The upfront cost is significant, $5,000 to $15,000, but the payback period in high-cost states is often three to five years.
- Smart thermostats reduce usage by 10 to 15 percent without sacrificing comfort. The devices cost $100 to $250 and pay for themselves within a year in most states.
- LED lighting is a no-brainer. Replacing all bulbs in a home cuts lighting energy use by roughly 75 percent. The upfront cost is minimal, with payback being immediate.
- Time-of-use plans shift usage to off-peak hours. In states with time-of-use pricing, running the dishwasher, doing laundry, and charging EVs overnight can lower bills by 10 to 20 percent.
- Solar panels are most cost-effective in high-rate states. A homeowner in California paying 32 to 35 cents per kWh will see faster payback than someone in North Dakota paying around 12 cents. The federal solar tax credit remains an important factor in the payback calculation, though households should confirm current credit terms before committing, as federal incentive programs can change.
Conclusion: Planning a move? Electricity costs are a major component of the homeownership equation. For a complete picture, explore HOMEiA’s True Cost of Homeownership by State guide to see how property taxes, insurance, and maintenance stack up, and use our Rent vs. Buy Calculator Guide to compare total monthly costs across your target cities.
Recommended for you




FAQs About Electricity and Utility Costs by State
1. Why are utility bills rising faster than inflation?
Aging infrastructure, data center demand growth, renewable energy transition costs, and wildfire mitigation expenses are all pushing rates higher.
2. Which state has the cheapest electricity?
North Dakota has among the lowest residential electricity rates in the country, at roughly 11.5 to 12.35 cents per kWh. Idaho, Nebraska, Iowa, and Montana also rank among the cheapest.
3. How much do utilities add to the true cost of homeownership?
Utilities add nearly $100 to $400 per month to housing costs, depending on the state and home size. In high-cost states like Hawaii and California, utilities can increase by $300 or more per month. In low-cost states like North Dakota and Idaho, utilities will be closer to $100 to $150 per month.
Share