







Housing vs. Groceries: Which Costs Actually Change When You Move?
- Local Editor:Local Editor: The HOMEiA Team
- Category: USA , Cost of Living



Housing vs. Groceries: Which Costs Actually Change When You Move? When most families plan an interstate move, they often assume every expense will shrink proportionally, with a 15 percent lower cost of living meaning 15 percent cheaper groceries, 15 percent cheaper housing, and 15 percent cheaper everything else. However, this assumption is usually wrong.
Regional Price Parity data reveals that while housing costs can swing dramatically across state lines, grocery prices remain comparatively stable. Understanding which costs actually change, and which do not, separates financially successful relocations from disappointing ones.
Key Takeaways
- Housing is the main volatility driver. Housing rent parity values range from nearly 54 in the lowest cost states to almost 155 in the highest cost jurisdictions, a seismic spread, while goods parity values tend to cluster more tightly around the national average.
- Groceries are tradable goods distributed through national supply chains, meaning common items cost roughly the same in high cost and low cost metros.
- Non-housing services fall in the middle. Childcare, eating out, and automotive repair shift by about 10 to 25 percent, driven by local labor costs that are tied to housing markets.
- A large majority of relocation savings usually come from reduced shelter costs, not from cheaper groceries or everyday items.
- Workers who accept broad cost of living pay cuts risk penalizing their purchasing power for goods that do not actually get much cheaper after the move.

Related article
True Cost of Homeownership by State (the first 20-State): What You Pay Beyond the Mortgage in 2026
A home’s purchase price is only part of the true cost of ownership. Beyond the mortgage, homeowners must budget for property taxes, insurance, utilities, maintenance, repairs, and, in some cases, homeowners association fees. These ongoing expenses can add thousands of dollars to the annual cost of owning a home…
1. The Myth of Uniform Cost of Living Savings
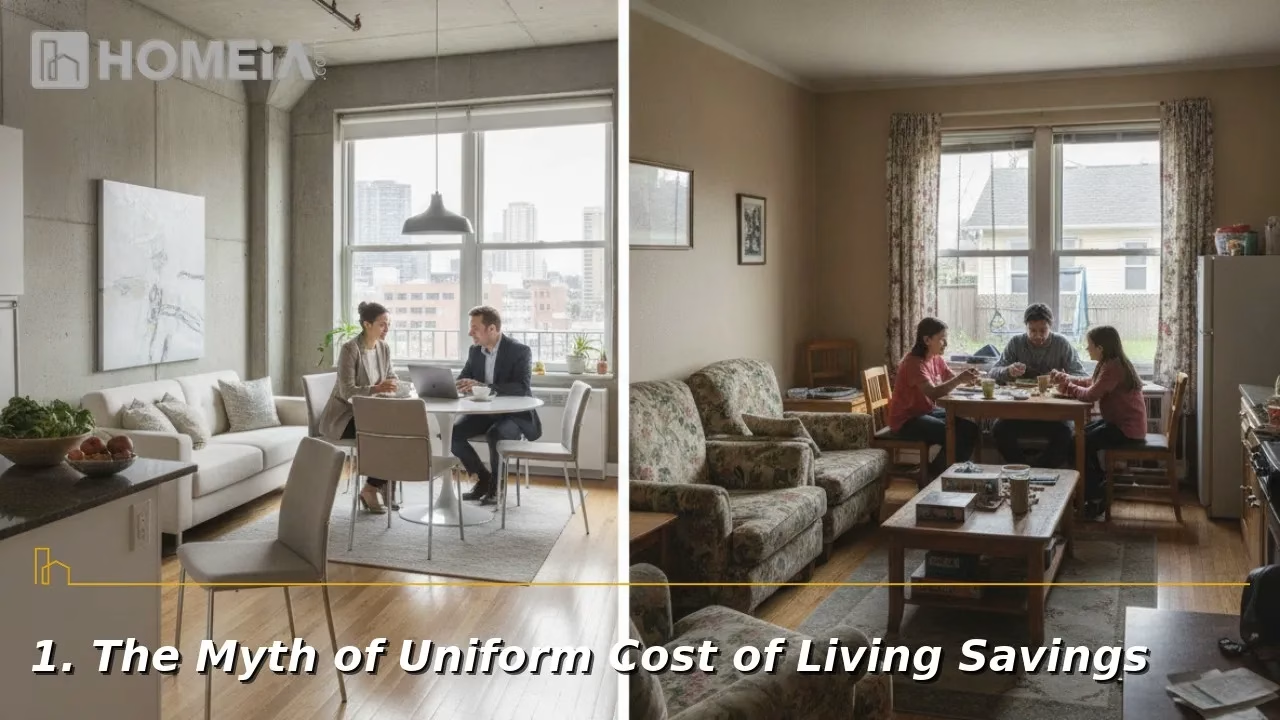
Moving to a lower cost state does not reduce every budget category equally. Housing costs can fall by 40 to 60 percent in some moves, but groceries and consumer goods often decline by less than 10 percent. Housing is a non-tradable asset tied to local land, while groceries are tradable commodities distributed through national logistics networks.
The proportional savings assumption is one of the most common and costly relocation mistakes. Families may assume a move from California to Iowa will reduce housing, groceries, electronics, and clothing costs equally by roughly 15 to 20 percent. Actual data shows an opposite pattern. Housing responds strongly to local land values and demand, while many goods do not.
Tradable vs Non Tradable Goods
| Category | Definition | Examples | Typical Price Behavior |
| Tradable Goods | Commodities manufactured centrally and shipped via national supply chains | Groceries, clothing, electronics, appliances | Narrow price band nationwide |
| Non Tradable Services | Location bound assets tied to local land and labor | Residential real estate, childcare, property maintenance, dining out | Strong local variation |
The law of one price helps explain why many tradable goods stay relatively stable. Wholesale distribution networks and national retailers ensure that a gallon of milk or a new smartphone is priced within a fairly narrow band across regions. Shipping costs for these items are a fraction of their final price.
By contrast, land cannot be transported. Residential real estate absorbs local economic demand in each market. You must buy or rent housing where the land exists, which itself is fixed. This fundamental reality drives gigantic geographic divergence in housing costs. That divergence is why so many renters are stretched; this report on rent burden in America found nearly half of renter households now spend over 30 percent of income on housing.

Related article
Grocery and Food Costs by State in 2026 (the first 10 States)
The cost of groceries varies significantly across the United States, making location an important factor in every household’s budget. Differences in transportation, supply chains, state taxes, and local market conditions can add hundreds (or even thousands) of dollars to annual food expenses. While national food inflation has moderated, prices continue to fluctuate…
2. The Empirical Data: Housing Rent Parity vs Goods Parity
Official data show extreme divergence between housing and goods. Housing rent parity values range from the mid 50s in some low cost states to the mid 150s in high cost jurisdictions. Goods parity values across those same states tend to cluster within roughly 10 percentage points of the national average. Groceries remain relatively stable because retail pricing reflects national wholesale costs, with local rent and labor accounting for a modest share of markup.
The Regional Price Parities framework is a key benchmark for understanding geographic cost variation. It splits the overall all items parity into three subindices: housing rents parity, goods parity, and other services parity, all measured against a baseline of 100. For a deeper look at how these parities translate into real purchasing power and relocation decisions, see this guide to geography as a cost-of-living lever.
BEA Regional Price Parities Sub Index Divergence (Illustrative 2024 Values)
| State or Jurisdiction | All Items RPP | Housing Rent RPP | Goods RPP | Services RPP |
| District of Columbia | 109.9 | 155.0 | 103.7 | 103.7 |
| California | 110.7 | 154.3 | 101.8 | 103.3 |
| New York | 110.0 | 143.5 | 103.5 | 106.5 |
| Illinois | 100.0 | 101.2 | 98.9 | 98.1 |
| Minnesota | 95.0 | 84.0 | 96.2 | 95.5 |
| Iowa | 87.8 | 68.5 | 92.8 | 93.0 |
| West Virginia | 88.1 | 54.2 | 95.8 | 90.2 |
| Mississippi | 87.0 | 60.2 | 91.7 | 89.5 |
| Arkansas | 86.9 | 61.4 | 94.1 | 89.0 |
B. Why Groceries Stay Relatively Stable
Retail grocery pricing reflects national wholesale markets more than local rents. Major chains operate centralized procurement and distribution systems, with smaller, regional chains purchasing surplus through national channels. Local land rent and labor, the primary drivers of housing cost variation, contribute only a limited portion of the retail markup on packaged goods.
For example, a can of soup might cost about 1.90 dollars in a high cost coastal city and around 1.80 dollars in a lower cost interior metro for the same brand and size. The difference is noticeable but modest compared with the gap in housing costs between those markets.

Related article
Emergency Fund Guide: How Much to Save Before Buying a Home
Buying a home requires far more than saving for a deposit and qualifying for a mortgage. Homeowners must also be financially prepared for unexpected repairs, maintenance, and other emergency expenses that can arise without warning. This guide explains why a strong emergency fund is just as important as your…
3. Non Housing Services: The Middle Ground

Labor dependent services, including childcare, dining out, automotive repair, and personal care, tend to fall between tradable goods and housing in volatility. Prices for these services commonly shift by about 10 to 25 percent after a move. This is due to service workers in high cost markets requiring higher nominal wages to afford area living.
Labor dependent services occupy the middle tier of the cost volatility spectrum. Unlike groceries, which are manufactured elsewhere and shipped in, services are produced and consumed locally. Their pricing reflects local labor costs, which are influenced by local housing markets.
A. Wage Coupling Explained
In the high housing cost markets of San Francisco or New York, service workers must be compensated higher nominal wages simply to afford basic shelter. These elevated wages then pass through to consumers in the form of higher prices for:
- Childcare and daycare centers
- Restaurant meals and takeout
- Automotive repair and maintenance
- Personal care services such as salons, barbers, and dry cleaning
- Home maintenance and landscaping
B. Budget Category Spatial Elasticity Matrix
| Expenditure Category | Classification | Spatial Volatility Post Move | Primary Price Drivers |
| Residential rent or mortgage | Non tradable asset | Very high (large range in parity values) | Local land scarcity, zoning, wage concentration |
| Childcare and education | Labor dependent service | High (about 10–25 percent) | Local wage rates, regulatory requirements |
| Dining out and restaurants | Labor dependent service | High (about 10–25 percent) | Local rent, labor costs, food distribution |
| Automotive repair | Labor dependent service | Moderate (roughly 8–15 percent) | Local labor rates, parts shipping |
| Utilities and energy | Resource dependent expense | Variable | Regional climate, energy sources, regulation |
| Groceries | Tradable good | Low (roughly 3–8 percent) | National supply chains, wholesale pricing |
| Clothing and electronics | Tradable good | Very low (about 0–5 percent) | E commerce, national distribution |
| Digital subscriptions | Digital good | None (about 0 percent) | National pricing, no geographic variation |
C. Utility and Climate Volatility
Energy, water, and heating costs depend on regional natural resources, local regulatory frameworks, and weather patterns rather than housing land values. A winter heating bill in a northern state can easily clear one in a mild climate state, independent of housing price levels. This is why comprehensive relocation analysis needs climate adjusted utility projections alongside housing comparisons.
Recommended for you




4. How Relocation Reshapes Your Household Budget Allocation

Post-move savings are concentrated in housing costs rather than daily living expenses. A family relocating from a high rent parity market to a lower rent parity market can save several thousand dollars per month on shelter alone, with groceries contributing only a percentage of total savings.
The purchasing power illusion is a critical trap for relocating workers. Employees accepting corporate cost of living pay cuts during a move to a cheaper city can weaken their purchasing power for tradable goods. If salary drops by 10 percent but grocery and electronics prices do not fall by 10 percent, real purchasing power for those categories declines.
A. Geographically Invariant Obligations
Several budget items do not change much regardless of where you live:
- Federal income taxes, which follow national progressive rate schedules
- Student loans, auto financing, and many national insurance premiums
- E-commerce purchases and digital subscriptions, which use national pricing
- Credit card debt and personal loans contracted at fixed rates
B. Post Relocation Monthly Budget Disaggregation Case Study
| Budget Category | High Cost Metro Outlay (Rent Parity 150) | Low Cost Metro Outlay (Rent Parity 60) | Absolute Monthly Difference | Share of Total Savings |
| Residential shelter | 3,500 dollars per month | 1,400 dollars per month | -2,100 dollars | 84.7 percent |
| Local services and dining | 1,200 dollars per month | 900 dollars per month | -300 dollars | 12.1 percent |
| Groceries and packaged goods | 800 dollars per month | 720 dollars per month | -80 dollars | 3.2 percent |
| Tradable goods and tech | 500 dollars per month | 500 dollars per month | 0 dollars | 0.0 percent |
| Total expenditure | 6,000 dollars per month | 3,520 dollars per month | -2,480 dollars | 100.0 percent |
This case study illustrates an important reality. In this scenario, approximately 85 percent of total monthly savings come from reduced shelter costs alone. Groceries contribute a few percent, while digital subscriptions and nationally priced goods contribute nothing. The core message is that relocation savings are primarily about housing, not groceries.

Related article
Electricity and Utility Costs by State in 2026 (the first 10 States)
Electricity costs vary dramatically across the United States, making utility bills a major factor in overall affordability. While some states benefit from abundant, low-cost energy resources, others face significantly higher rates because of fuel costs, grid infrastructure, and energy policies. As electricity prices continue to rise nationwide, understanding state-by-state…
5. Calculating Your Post Move Savings: The Disaggregation Model

The disaggregation model splits relocation savings into three tiers with fixed invariant expenses, semi variable local services, and highly variable housing. This approach reduces the risk of overestimating savings and helps households make more precise relocation decisions.
A. The Three Tier Budget Disaggregation Framework
- Tier 1, Fixed invariant expenditures (about 0 percent change): federal income taxes, student loans, auto financing, national insurance, e-commerce, digital subscriptions, and contracted debt obligations.
- Tier 2, Semi variable local services (roughly 10–25 percent change): childcare, dining out, automotive repair, personal care, home maintenance. These shift with local labor costs but remain lighter than housing.
- Tier 3, Highly variable housing overhead (roughly 30–60 percent change): rent, mortgage payments, property taxes within reasonable limits, and homeowners insurance tied to replacement cost.
B. Mathematical Disaggregation Model
Real savings = (Housing origin − Housing destination) + (Services origin − Services destination) + (Tradable goods origin − Tradable goods destination) − Relocation friction
Where:
- Housing origin and destination are annual shelter costs at the current and target locations.
- Services origin and destination are annual local service costs, including childcare, dining, and repairs.
- Tradable goods origin and destination are annual goods costs, notably groceries, clothing, and electronics, which often show minimal differences.
- Relocation friction is the total moving expense amortized over a reasonable time horizon.
C. Illustrative Case Study
Consider a household with 100,000 dollars of income relocating from a high housing cost city such as Honolulu to a lower housing cost metro such as Tampa. Using current parity values, an example move might show shelter costs dropping from about 3,500 dollars per month to around 1,500 dollars per month.
That change represents roughly 24,000 dollars in annual housing savings. Local service costs might fall by 10 to 15 percent, adding several thousand dollars in annual savings, while goods savings remain modest. After subtracting a plausible 6,000 dollar moving cost, net first year savings can still exceed twenty thousand dollars.

Related article
Childcare Cost Calculator by State in 2026
Childcare is one of the largest recurring expenses for American families, and costs vary dramatically from state to state. In many high-cost states, full-time infant care rivals or even exceeds annual housing expenses, while more affordable regions offer substantially lower out-of-pocket costs. Differences in wages, childcare availability, and public funding all influence what families ultimately pay. This guide compares childcare costs across the United States,…
6. Actionable Relocation Audit and HOMEiA Expense Assessment

A pre-move budget audit that tracks 12 month expenses across shelter, services, and goods, then applies housing parity ratios specifically to shelter costs while keeping tradable goods near baseline, provides a more accurate picture of relocation savings. This prevents one from applying blanket discount rates to every budget category.
A. Pre Move Budget Audit Steps
- Audit current 12 month trailing expenses across three buckets:
- Shelter, including rent or mortgage, utilities, and insurance
- Local services, including childcare, dining, auto repair, and personal care
- Goods, including groceries, clothing, electronics, and household supplies
- Apply housing parity ratios specifically to shelter costs, as opposed to the entire budget.
- Hold tradable goods assumptions close to baseline in the new budget model. Do not apply deep discounts to groceries or nationally priced items without evidence.
- Model semi variable services as a 10 to 25 percent adjustment from origin costs, depending on the destination’s labor market and housing conditions.
- Implement the model with a 15 percent contingency buffer for unexpected post move expenses, such as overlapping leases, deposits, and one time purchases.
B. Utilizing the HOMEiA Evaluation Framework
Connecting with HOMEiA’s city by city housing tools, cost calculators, and verified local real estate professionals helps validate assumptions before committing to a move. The most expensive relocation mistake is moving based on myths rather than data. Households weighing an international move instead of a domestic one should compare the two paths in this guide to moving states versus moving countries, which breaks down tax treatment by income type.
Conclusion
Understanding which costs impact when you relocate is essential to making a financially sound move. The evidence points clearly to housing as the dominant driver of relocation savings, while groceries and most tradable goods contribute only modest changes.
Workers accepting broad cost of living pay cuts without analyzing category level impacts risk eroding their real purchasing power for expenses that will not materially decline.
Recommended for you




FAQs About Housing vs. Groceries Costs
1. Do groceries get significantly cheaper when you move to a lower cost state?
Typically not. Groceries are tradable goods distributed through national logistics networks. While housing costs can shift sharply across state lines, grocery prices usually vary by a modest amount, often under 10 percent for many items. A box of cereal or a common pantry staple tends to cost roughly the same in San Francisco as in Des Moines, with only limited variation.
2. Which expense changes the most when you relocate?
Residential housing, including rents and home prices, is by far the most volatile expense. Housing rent parity values range from the mid 50s in areas like West Virginia to the mid 150s in the District of Columbia. Shelter cost reductions drive the majority of total relocation savings, far exceeding changes in groceries, clothing, or other consumer goods.
3. Should I accept a cost of living pay cut when moving to a cheaper city?
Not without careful analysis. If an employer offers a pay cut based on overall cost of living, verify which categories the adjustment formula considers. Since housing is the only major category that changes dramatically, a proportional pay cut based on total cost of living may lower your salary for categories such as groceries and electronics that do not actually become much cheaper. It is wise to separate housing related adjustments from goods and services in negotiations.
4. Do utilities and transportation costs vary significantly by location?
Yes, but typically less than housing. Utility costs can vary by climate, energy sources, and local rates, while transportation expenses depend on commute distance, fuel prices, and access to public transit. These differences can add up but usually do not outweigh housing savings.
5. Are goods and services other than groceries cheaper in lower-cost states?
Only modestly. Many goods, notably electronics, clothing, and household items, are priced nationally or globally, so differences are limited. Local services, such as childcare, dining, and personal care, may be economical, but the variation is generally smaller compared to housing costs.
Share